
Abstract
With increasingly more apps added to the Google Play Store, the security of those apps is a concern. Users cannot sort apps based on their expected permissions. An interface was designed that allows users to specify their ideal permissions for an app. The ideal permissions are used to evaluate a list of apps based on proximity to that ideal. Apps are presented to indicate greater or less security using cues of color and presentation order. A survey was conducted to see whether the interface discouraged users from downloading an app that requires many permissions when compared to information provided by the Google Play Store. Most users showed significant concern towards their mobile app security, with 50 % of the users responding to the interface with greater concern over the app requiring many permissions. The research concludes that increasing user awareness of security increases user selection of more secure apps.
You have full access to this open access chapter, Download conference paper PDF
Keywords
1 Introduction
Currently, the only convenient way to make choices about what Android app to use based on permissions settings is to cycle through the most popular apps on the Play Store to decide which app requires the fewest permissions (Fig. 1). This process can clearly be automated, and the results of such a process can be presented in an informative way.

An example of a typical permissions info page
The number of apps in the Google Play Store continues to grow. As of January 2015, there were 1.43 million apps [1] and as of May 2013 there were 48 billion app downloads [2]. When examining the twelve most downloaded apps in the Google Play Store as of July 2015 [3], adding together the permissions each app required, as represented by a bullet point on the list of permissions, the average number of permissions required is 28, and the total number of permissions required ranges from 6 to 52. In response to this approach, an alternative user interface to the Google Play Store’s permissions view is presented, which consolidates an app’s permissions settings based on user preference. The interface presented here uses visual cues such as color and presentation to influence user behavior [4], and also provides a quantitative score for each app.
2 Related Work
Prior research concerning how to analyze apps and give users better information based on their subjective expectations about the app [5] showed that influencing user behavior to be more privacy-focused can be done through the use of nudges [6]. Presentation order has been demonstrated to be an effective cue in influencing user perception of security [4]. Color coding using a gradient from green to red, where green is “good” and red is “bad” has also been shown to be an effective cue [4]. Nudges can influence users to interact with their privacy settings [6].
Previous research has also looked at the API-side of the security issue [7] which tried to influence developer behavior by granting more granular information about the user’s location. However, with so many incentives to track users such as advertising, the approach presented here focused on being more productive by empowering users to control their privacy.
3 AppRater
An initial comparison of static and dynamic analyzers was done to see strengths and weaknesses (Table 1).
Almost all of the analyzer tried had serious problems. The static analyzers often did not provide useful information other than the permissions manifest, and the dynamic analyzers were challenging to install.
The permissions manifest is a list of all the permissions an app can access. This information is not very helpful because the user already sees the list of permissions when they first install the application. However, since that was the most readily available information with respect to an app’s security, it was worthwhile to present the same information available from the manifest to the user in a more helpful interface. Users could select which permissions were acceptable or unacceptable, and a score is produced based on how an app agrees with a user’s permissions preferences.
Two algorithms were experimented with while building the new interface. Both algorithms work similarly, but were based on two very different input types.
The first algorithm (Fig. 2) displayed the options on a Likert scale from 0 to 5, where 5 meant “no opinion about this permission” and 0 meant “strongly negative opinion about this permission.” Algorithm 1 associated with this scale would give an app an “absolute score” based on how many unwanted permissions were in the app. This “absolute score” would then be divided by the worst possible score; that is, the score an app would have if it had every unwanted permission. The result would be subtracted from 100 % to produce a final score.

Likert scale for user responses related to user tolerance for app permission request indicated (Algorithm 1)
The other algorithm, Algorithm 2, is the one used for the scores shown in the actual survey. This other interface distinguishes “tier” permissions, such as no location, coarse location, or fine location and “boolean” permissions, such as no network access or network access allowed. The motivation for this new interface was that a user seems unlikely to want coarse location when they do not want fine location, so whether an app compared well to a user’s location preferences was given double the weight compared to other permissions if the user does not want their fine location shared. The second algorithm compared the actual permission to the worst possible score per permission and took the average of those scores. This had the unexpected effect of putting a lower boundary on the score an app could have. This was considered acceptable for the initial effort, but eventually it would be good to reconsider the algorithm.
3.1 Upload Interface
Several benefits with Androwarn analyzer included the software being easy to set up, easy to use, and the results could be output as plain-text or html. The only severe problem is that Androwarn failed to accept some apps as input. Because of these benefits, Androwarn was a good candidate for extracting the permissions manifest from the apps, a script was written to call Androwarn when the user uploads an app.
3.2 Selection Interface
An interface was written in Gauche Scheme which uses a simple algorithm to compare apps. Each app is evaluated and compared with the user’s requested behavior. First the user is presented with an interface to select which permissions are important to them (Fig. 3).

AppRater menu - user view
3.3 Results Interface
Using the Algorithm 2 described earlier, a score from 0 to 100 percent is produced, where 100 indicates an app that agrees with the user’s preference and 0 indicates an app that disagrees with the user’s preference. The results are then displayed to the user. Highest rated apps are displayed at the top, with lower rated apps placed at the bottom. As an additional visual cue, apps change color based on their score: a score below 60 is red, with the scale progressively turning yellow then green, which is the color for a score above 90 (Fig. 4).

App rate results view, as presented to user (Color figure online)
4 Methods
A survey of five questions, designed to evaluate the effectiveness of the new interface to influence the user was distributed by e-mail to a community of university students. It was hypothesized that the interface will make users more concerned about app security because it provides a clear feedback comparing the apps, instead of displaying a long list of permissions which the user may not be concerned with. Rather, it allows the user to select which permissions matter and consolidate the results based on that information.
5 Results
Responses to the survey (n = 58) were interesting. First, users were asked which app they preferred when given the following choice and were only shown the permissions manifest from the Google Play store.
-
App 1 used the manifest from WhatsApp, a well-known messaging app, and was meant to resemble a typical app that requires many permissions (Fig. 5).
Fig. 5. 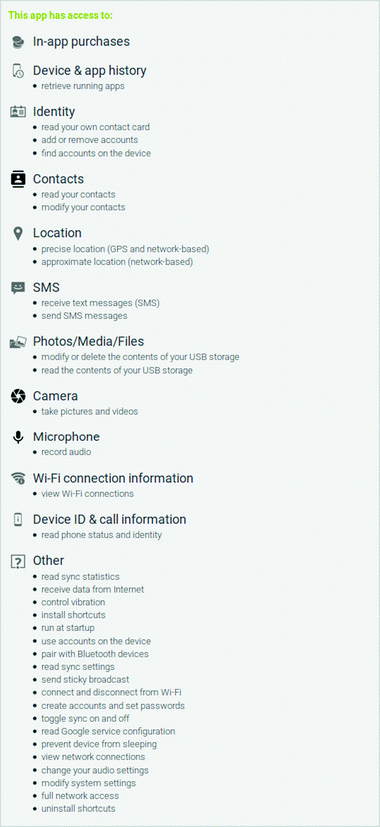
App 1
-
App 2 used the manifest from Xabber, a less-known messaging app, and was meant to resemble a typical app that does not require many permissions (Fig. 6).
Fig. 6. 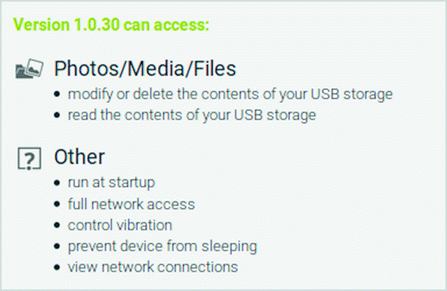
App 2


The majority of participants (64 %) preferred App 2 when presented with the permissions interface. A significant portion of users (22 %) said they preferred App 1. This was not expected given the contents of the permissions list, considering that the permissions for App 1 are much broader than the permissions given to App 2. This may be a topic for future research.
Half of the participants felt less comfortable after seeing the new interface. 36 % of participants had no change of opinion. This indicates that the developed interface was effective at influencing user opinion of the apps.
There were only very weak linear correlations between the answers given. The questions for awareness and concern had a positive correlation of 0.219. It makes sense that those people who are more concerned with app security will also be more aware.
More significantly, the linear correlation coefficient of the question for concern and reaction to the permissions settings had a positive correlation of 0.293. It also makes sense to suppose that respondents who were more concerned about privacy would be more taken aback by App 1’s permissions screen.
Therefore, while nothing conclusive can be said about the correlations observed, there is some evidence that users who are concerned about mobile app security do make choices based on the broadness of permissions.
6 Conclusion
In conclusion, this research indicates that users are concerned about their privacy, and, as a result of their concern, will make decisions based on the broadness of permissions when given a side-by-side offering. In addition, when information about permissions is presented in a simple way, users may form new opinions about the app. By refining the algorithm in this interface, users can search for new apps using specific guidelines about how many permissions they want their app to have.
Some of the results are confusing. For example, it was not expected that as many as 22 % of the users would select the app with the much longer list of permissions. Future work on this topic includes asking users to elaborate on their motivation for selecting one app over the other.
References
Michaeli, A.: App Stores Growth Accelerates in 2014 (2015). http://blog.appfigures.com/app-stores-growth-accelerates-in-2014/. Accessed 28 July 2015
Welch, C.: Google: 900 million android activations to date, 48 billion app installs (2013). http://www.theverge.com/2013/5/15/4333584/total-android-activations-900-million. Accessed 30 July 2015
Android App Ranking (2015). http://www.androidrank.org/. Accessed 30 July 2015
Turland, J., Coventry, L., Jeske, D., Briggs, P., van Moorsel, A.: Nudging towards security: developing an application for wireless network selection for android phones. In: Proceedings of the 2015 British HCI Conference (British HCI 2015), pp. 193–201 (2015)
Lin, J., Amini, S., Hong, J.I., Sadeh, N., Lindqvist, J., Zhang, J.: Expectation and purpose: understanding users’ mental models of mobile app privacy through crowdsourcing. In: Proceedings of the 2012 ACM Conference on Ubiquitous Computing (UbiComp 2012), pp. 501–510 (2012)
Almuhimedi, H., Schaub, F., Sadeh, N., Adjerid, I., Acquisti, A., Gluck, J., Cranor, L., Agarwa, Y.: Your location has been shared 5,398 times! A field study on mobile app privacy nudging. In: Proceedings of the 33rd Annual ACM Conference on Human Factors in Computing Systems (CHI 2015), pp. 787–796 (2015)
Jain, S., Lindqvist, J.: Should i protect you? Understanding developers’ behavior to privacy-preserving APIs. In: Workshop on Usable Security (USEC 2014) (2014)
Author information
Authors and Affiliations
Corresponding author
Editor information
Editors and Affiliations
Rights and permissions
Copyright information
© 2016 Springer International Publishing Switzerland
About this paper
Cite this paper
MacDuffie, J.K., Morreale, P.A. (2016). Comparing Android App Permissions. In: Marcus, A. (eds) Design, User Experience, and Usability: Technological Contexts. DUXU 2016. Lecture Notes in Computer Science(), vol 9748. Springer, Cham. https://doi.org/10.1007/978-3-319-40406-6_6
Download citation
DOI: https://doi.org/10.1007/978-3-319-40406-6_6
Published:
Publisher Name: Springer, Cham
Print ISBN: 978-3-319-40405-9
Online ISBN: 978-3-319-40406-6
eBook Packages: Computer ScienceComputer Science (R0)