
Abstract
Objective Video Quality Assessment (VQA) is often used to predict users visual perception of video quality. In the literature, the performance evaluation of objective measures is based on benchmark subjective scores of perceived quality. This paper shows the evaluation of an algorithmic measure on videos presented on mobile devices. The VQA measure is called Sencogi Spatio-Temporal Saliency Metric (Sencogi-STSM), and it uses a spatio-temporal saliency to model subjective perception of video quality. Since STSM was previously validated with a subjective test conducted on laptop computers, the goal of this work was to verify whether the measure is able to significantly predict users’ perception of video quality also on mobile devices. Results show that, compared to the standard VQA metrics, only Sencogi-STSM is able to significantly predict subjective DMOS. This paper describes Sencogi-STSM’s biologically plausible model, its performance evaluation and the comparison with the most commonly used objective VQA metrics.
You have full access to this open access chapter, Download conference paper PDF
Keywords
1 Quality Assessment Today
1.1 Introduction
Subjective testing with human participants is still the most reliable method to assess the perceived quality of an image or a video, even though it requires high cost and time effort. In order to measure participants’ opinion scores of quality, standard recommendations are currently used, but the whole evaluation procedure often results in time-consumption and requires high costs. To avoid the cost and delay of subjective quality evaluation, objective quality assessment methodologies that do not involve participants are proposed in the literature to be used instead of subjective tests.
As Chikkerur and colleague highlights in 2011 [1], “the fidelity of an objective quality assessment metric to the subjective assessment is considered high if the Pearson and Spearman correlation coefficients are close to 1 and the outlier ratio is low. Some studies use the Root Mean Square Error (RMSE) to measure the degree of accuracy of the predicted objective scores. For the 95% confidence interval, it is desirable that the RMSE be less than 7.24”. Following the methodology recommended by the ITU Telecommunication Standardization Sector [2], this study uses the aforementioned four analyses to compare objective and human video quality scores. None of the most used objective measurements seems to be able to adequately model human vision in the range of conditions used in typical subjective tests [3].
There are three types of objective video quality assessment methods: full-reference, wherein a an undistorted image or video is fully used for comparisons with distorted videos, reduced-reference, which use only some features of the undistorted quality reference image or video, and no-reference methods, wherein the reference video is not available at all [2]. This paper considers only full-reference methods.
1.2 Image and Video-Frame Quality Assessment
The next two paragraphs briefly show the state of the art of both image and video quality assessment. They also describe some of the most used image quality assessment metrics because they are often used to predict subjective video quality too.
Image Quality Assessment (IQA) metrics aim to measure the quality of a single static image. IQA metrics can also be used to measure video quality by treating the video stream as a collection of images, and calculating an aggregate score. In the literature, there is a wide choice of IQA metrics, such as Peak Signal to Noise Ratio (PSNR), Structural Similarity index (SSIM), Mean Structural Similarity (MSSIM), Universal Quality Index (UQI), Information Content Weighted Peak Signal to Noise Ratio (IWPSNR), Visual Information Fidelity (VIF), Feature Similarity Index (FSIM), Generalized Block-edge Impairment Metric (GBIM), NR Blocking Artifact Measure (NBAM), NR Perceptual Blur Metric (NPBM), Just Noticeable Blur Metric (JNBM). These IQA metrics include full reference and no reference metrics, and range from the purely pixel-based IQMs without the characteristics of the human visual system (HVS) to IQA metrics that contain complex HVS modeling. The ITU recommendations suggest using full reference measure in order to directly compare objective estimates of subjective quality and human quality evaluations. For this reason, and since video encoders have access to full reference, in this paper we only focus on full reference measures.
Among the above listed measures, the full reference measures are Peak Signal to Noise Ratio (PSNR), Structural Similarity Index (SSIM), Multiscale Structural Similarity (MSSIM), and Universal Quality Index (UQI). PSNR calculates pixel-by-pixel the mean squared error between a distorted image and its high quality copy. PSNR is widely used since it returns a measure of distortion and noise that is easy to calculate. PSNR has also been extended with a pooling strategy of the locally calculated distortions, in order to incorporate some of the temporal features of human vision into PSNR. However, PSNR does not account for human visual perception, since its model treats pixels as being of equal importance and is unaware of any relationship between pixels. For this reason, PSNR is increasingly becoming inadequate for newer video codecs that apply visual perception models to remove data that falls beyond the threshold of visual perception.
SSIM aims to calculate how much an image or a video frame is “structurally similar” to the way the human visual system perceives quality. When an image or a video-frame is compressed, there is a change in structural information. SSIM has been also extended with a pooling strategy (i.e., the information content weighting) of the locally calculated distortions. Compared to PSNR, SSIM also considers pixels interdependency, which conveys important information about the structure of visual scene. Three visual components of an image are considered to calculate an SSIM value: luminance (high values are weighed more) contrast (locally unique values for pixels are weighed more) and structure (the more pixel values change together with their neighbors, the more they are weighed). The structure of each point is the covariance of x and y over the product of the variance x and y [4].
The perception of static images, such as video frames, is different than the perception of an entire moving video. Compared to static images, the continually changing visual stimuli of video-frames require more visual attentional from a viewer to process salient information. For this reason, the most-used image and video quality assessment metrics are not able to fully account for the HVS observing video. In a large-scale subjective study conducted by Seshadrinathan and colleagues to evaluate different video quality assessment algorithms [5], the authors found low correlation values for both PSNR (Spearman rho = 0.36; Pearson r = 0.40) and SSIM (Spearman rho = 0.52; Pearson r = 0.54) when compared to subjective values. The traditional video quality metrics, such as speak-signal-to-noise ratio (PSNR) or signal-to-noise ratio (SNR), are known to neglect the characteristics and the viewing conditions of human visual perception [6].
PSNR and SSIM are the most used measures to estimate image and video-frame quality, even though their model is not able to account for some aspects of the HVS, such as saliency processing. Therefore, new objective VQA models are still needed that are able to calculate the salient parts of video information.
1.3 Saliency Perception Models
One of the most important attention processes guiding visual perception is saliency. Saliency works like a filter that directs cognitive resources toward a subgroup of elements that may be significant for a certain visual context, allowing the HVS to process only partial amounts of information from a wide amount of information. Without the saliency regulation of attentional processes, large amount of information could overload the cognitive system [7] by accessing higher level processing systems in the brain.
In the literature, saliency perception models are based on either a bottom-up or a top-down main theoretical approach. The bottom-up approach is based on the visual saliency hypothesis, which describes visual attention as a data-driven answer to visual information [8], whereas the top-down approach is based on the cognitive control hypothesis [8, 9]. The bottom-up approach is the most studied one, and describes the process of selecting an area to fixate as a feature-guided process. On the other hand, according the top-down approach, visual attention is guided by context, task-related demands, and perceivers’ needs. In the top-down approach, visual stimuli are still relevant as for the bottom-up one, but they are strictly related to cognitive information rather than on the saliency of visual data in itself [7].
Saliency is the primary process involved in subjective quality perception [10]. Many image quality assessment approaches attempt to use visual saliency to predict visual quality [11], and some efforts combine saliency with traditional measures of quality to produce saliency-weighted SSIM and PSNR performance [12].
1.4 Video Quality Assessment Based on Saliency Models
In order to determine salient areas, some spatial saliency algorithms [13] use frequency domain methods [14,15,16,17,18,19,20] reacting to patterns in the image. The algorithms that are based on frequency domain spatial saliency are biologically plausible and in line with the features of the human visual cortex [21] and are able to deal with most of the issues that usually arise in spatial salience calculation methods [9, 22], such as, for example, low resolution salience maps, and distorted object borders.
Calculating saliency of videos is more complicated than analysing still images because the regions of consecutive frames have a spatio-temporal correlation. Spatio-temporal correlation among video-frames changes the importance of each image in a scene, thus leading to different saliencies [23]. Some VQA methods deal with the changing salience of videos by incorporating spatial measures of salience, thus performing significantly better than traditional VQA methods [11]. However, these models only consider within-frame spatial saliency, neglecting to calculate between-frames spatio-temporal saliency. The primary reason why spatio-temporal saliency is rarely used for video compression is that it is difficult to discriminate salient motion from the noise produced by compression codecs or camera sensors [23, 24]. New measures are able to overcome noise related issues are still needed.
2 Spatio-Temporal Saliency for Video Quality Assessment
2.1 Cogisen’s Video Compression Algorithm
This paper describes a saliency VQA metric called Sencogi Spatio-Temporal Saliency Metric (Sencogi-STSM), which looks at change in saliency as a measure of distortion and calculates video quality by applying spatio-temporal saliency principles. The Sencogi VQA metric is able to predict subjective quality of videos compressed by saliency-based codecs. The metric is based on a video compression spatio-temporal saliency algorithm developed by Cogisen [25].
Lossy image and video compression algorithms are closely related to quality assessment metrics because a successful compression algorithm must remove the maximum amount of information with minimal effect on quality. To achieve this trade-off, image and video compression algorithms include a tuned model of the human visual system. A compression algorithm generally calculates which parts of a video frame would influence the human perceived quality, and uses this information to compress data more heavily in the parts that are less visually salient, in order not to affect perceived image quality [9] (Fig. 1).

Cogisen’s saliency algorithms used to differentially compress video.
2.2 Cogisen’s Saliency Algorithm
The VQA metric developed by Cogisen is based on saliency algorithms for video compression. Cogisen developed a very fast frequency-domain transformation algorithm called Sencogi, and used it to calculate frequency-domain saliency for a saliency-based image compression algorithm [26, 27]. Cogisen’s saliency algorithm differs from most other saliency algorithms because it also predicts whether compression artifacts will cause a change in saliency. This is particularly important when saliency is used as a driver for varying compression levels, because perceptible image quality degradation can lead to perceptible changes in an image’s low-level features on which bottom-up saliency models are based [11].
When working with low resolutions, the number of pixels to calculate edges and contrasts may be not enough, so video encoders may find it difficult to estimate saliency. However, due to the pervasive use of devices such as smartphones and tablets, video compression algorithms that are able to compress low resolution video recordings or live videos streamed with devices with limited processing capacity and bandwidth are needed.
As described in [27], Cogisen’s algorithm uses four saliency drivers so that information removal in one domain does not introduce salient artifacts in another domain. In Cogisen’s algorithm, “four different types of saliency algorithms are simultaneously run on a real-time video stream and combined to drive the codec’s variable macro-block compression” [27]. In order to create Sencogi- STSM, Cogisen’s saliency-based compression algorithms were used. The four types of saliency computed are:
-
Pixel noise detection. Pixel noise detection is developed to discern between motion and pixel noise because video codec’s cannot discern genuine scene motion from sensor pixel noise.
-
Static image saliency. The static image saliency algorithms calculate saliency within each video frame.
-
Spatio-temporal saliency. The spatio-temporal saliency algorithms calculate saliency between video frames.
-
Delta-quality saliency. The delta-quality algorithm calculates whether the quality changes of a video can affect the scene saliency [28] by introducing artifacts that are subjectively perceived by viewers.
The combination of all four saliency algorithms are used to make a saliency map that drives the codec’s variable macroblock compression. The use of four simultaneous saliency algorithms on a real-time video stream is possible because of the very fast Sencogi frequency-domain conversion. The four saliency drivers ensure that information removal in one domain does not introduce salient artifacts in another domain. The four algorithms are weighted by tunable thresholds, and then added to form a global saliency map (Fig. 2).

Figure shows Cogisen’s saliency algorithms combined to form an overall saliency map.
2.3 Sencogi Spatio-Temporal Saliency Metric
The Sencogi Spatio-Temporal Saliency Metric is a VQA score calculated by comparing the saliency maps of the compressed video to the saliency map of the reference video. The comparison of saliency maps is performed using SSIM (Fig. 3).

The Sencogi-STSM VQA is measured as a change in saliency map.
3 Performance of Sencogi Spatio-Temporal Saliency Metric
3.1 Methodology
In a previous paper [27], the performance evaluation of Sencogi-STSM with laptop computers was described. The aim of this paper is to verify whether Sencogi-STSM is able to significantly predict users’ perception of video quality also on mobile devices, in a way that is significantly more accurate than the most commonly used VQA metrics, i.e., PSNR and SSIM.
The evaluation of the performance of the Sencogi-STSM followed the same methodology as in the previous work [27]. We used a subjective a benchmark database to compare with objective measures calculated with PSNR, SSIM, and Sencogi-STSM. Finally, the performance of all objective models was tested by the Spearman Rank Order and the Pearson Linear correlation measures, the Outlier Ratio, and the Root Mean Square error, between subjective and objective scores.
3.2 Subjective Evaluation
Method. A benchmark subjective video quality database was created by using five video clips compressed at two different Constant Rate Factor values (CRF 21 and CRF 27), and by two different compression methods, i.e. X264 and a saliency based compression model. We used a saliency-based model to create a version of reference videos that keeps similar subjective perception of quality but uses higher compression levels [26, 27]. Finally, the subjective quality of five reference videos compressed by two compression methods at two compression levels (CRF) was evaluated in order to create a video quality assessment database.
Material.
The subjective test used five high technical-complexity benchmark videos, lasting less than 10 s. Videos were in the uncompressed YUV4MPEG 4:2:0 format, in 426 × 224 landscape resolution. Reference videos were compressed with a visually lossless CRF value of 10, and then compressed to CRF 21 and CRF 27 by both the H264 model and the saliency based model.
Procedure.
The procedure used for the subjective test was the Single Stimulus Continuous Quality Scale (SSCQS) method with hidden reference removal [3], which shows only one video at a time. The test was administered to mobile devices users only, by means of a web-based survey software tool called SurveyGizmo [29] with a methodology that has been previously validated by the authors [26, 27].
At the beginning of the subjective test, an example of a high quality video is shown, then reference high quality videos and compressed videos are randomly presented for each participant, in order to make sure that each video is presented only once in the succession. For each video, viewers are asked to rate the quality by using a slider marked from 1 to 100. The scale was divided into 5 equal parts labeled with the adjectives “Bad”, “Poor”, “Fair”, “Good”, and “Excellent”.
Pre-screening conditions were set. Before beginning the test, users were asked to: plug their smartphone to a power connector, set the smartphone display to its maximum brightness; use only the Wi-Fi connection and disable any other type of internet connection mode; set the display orientation in the vertical (landscape) mode. Download speeds were tested and those with less than 40 megabits per second were excluded from the test. Users were also asked to report the lighting conditions under which they were performing the test, their position of use (e.g. seated on a chair, standing up), and the model of the smartphone they were using, its display size and resolution.
Subjects.
Thirty-six participants completed the subjective test in a single session on June, 2017 (mean age 31.9 years old, 36.1% male, 13.8% expert viewers, 22.3% indoor with artificial lights, 77.7% indoor with natural lights, 100% sitting position, smartphone brands: 38.8% Apple iPhone 5/6/7, 36.1% Samsung Galaxy S6/S7, 25.1% other brands and models, smartphone screen-size: 41.7% 4.7/4.87 in., 58.33% 5.1/5.5/5.7 in.). Twelve outliers were removed.
Results.
The internal consistency of the scale was validated by using Cronbach’s alpha (alpha = 0.968) and Spearman Brown split-half value (rho = 0.942) (Cronbach’s Alpha = 0.944 for the first half and alpha = 0.941 for the second half).
For each subject, the Mean Opinion Scores assigned to the reference videos were used to calculate the Difference Mean Opinion Scores (DMOS) (CRF 21: H264 = 63, Saliency based compression DMOS = 63.87, CRF 27: H264 = 56.9, Saliency based compression DMOS = 54.35) (Table 1) between reference videos and the related compressed videos using the formula explained in the previous work [27].
3.3 Objective VQA Prediction of Subjective Scores
Three objective VQA metrics were used to evaluate the same videos used during the subjective evaluation: (1) PSNR; (2) SSIM; (3) Sencogi-STSM (means: PSNR = 35.898; SSIM = 0.951; Sencogi-STSM = 3.190). Detailed results are reported in Tab. 1.
3.4 Prediction Performance: Comparative Analyses
Method. Four analyses comparing objective and subjective scores were performed by following the methodology recommended by the ITU Telecommunication Standardization Sector [2]: (1) Spearman Rank Order Correlation Coefficient (SROC); (2) Pearson Linear Correlation Coefficient (PLCC) (calculated after a nonlinear regression with a logistic function, as recommended by the ITU standards [3]); (3) Root Mean Square Error (RMSE); all calculating how much the VQA metric predicts subjective scores; (4) Outlier Ratio (OR), which calculates percentage of the predictions number that falls outside plus/minus 2 times the standard deviation of subjective DMOS.
Results
-
(1)
Spearman Rank Order Correlation calculated on all types of compression combined show a significantly positive correlation between all objective measures and subjective scores: Sencogi-STSM values and DMOS values (rho = 0.655, p < 0.01), SSIM and DMOS values (rho = 0.627, p < 0.01), and PSNR and DMOS values (rho = 0.464, p < 0.05). Results on highly compressed videos (CRF 27), show that both Sencogi-STSM (rho = 0.503, p < 0.05) and SSIM (rho = 0.539, p < 0.01) are able to significantly predict subjective DMOS, whereas PSNR (rho = 0.248, p > 0.05) shows no significant correlation with DMOS values.
-
(2)
Pearson Linear Correlation Coefficient on all videos and all types of compression CRF show a significant correlation between Sencogi-STSM and DMOS (r = 0.625, p < 0.01), between SSIM and DMOS (r = 0.632, p < 0.01), and between PSNR and DMOS (r = 0.451, p < 0.05). Results on highly compressed videos (CRF 27) show that only Sencogi-STSM (r = 0.472, p < 0.05) is able to significantly predict subjective DMOS. No significant correlation between PSNR and DMOS (r = 0.001, p > 0.05) and SSIM and DMOS (r = 0.246, p > 0.05) was found (Fig. 4).
Fig. 4. 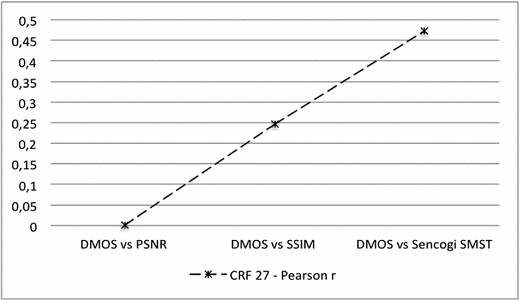
Pearson Linear Correlation Coefficient between subjective and objective scores assigned to videos compressed at a CRF 27 value.
-
(3)
Paired t test of the Root Mean Square Error scores shows a significant difference between Sencogi-STSM scores and PSNR scores (t(10) = 7.757, p = 0.000), and SSIM (t(10) = 4.667, p = 0.001), meaning that Sencogi STMS has RMSE values significantly lower than both traditional objective measures (Sencogi-STSM RMSE = 7.049; SSIM RMSE = 8.508; PSNR RMSE = 29.652). Results on highly compressed videos (CRF 27), show a significant difference between both PSNR (RMSE = 23.153) and SSIM (RMSE = 11.207), and Sencogi-STSM (RMSE = 9.290), which has significantly lower prediction scores compared to the other objective measures (Sencogi-STSM vs PSNR: (t(4) = −3.506, p < 0.01; Sencogi-STSM vs SSIM: (t(4) = −15.403, p < 0.01) (Fig. 5).
Fig. 5. 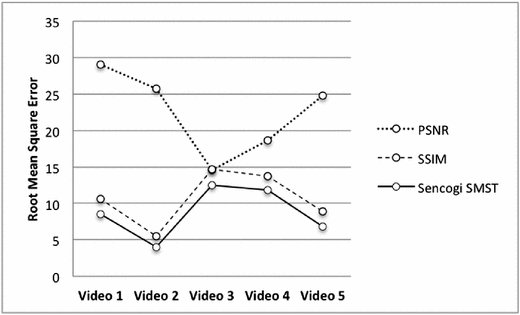
Figure shows the Root Mean Square Error value of PSNR, SSIM, and Sencogi-STSM. The lower the RMSE value, the higher the degree of accuracy of the predicted objective scores is. Results on paired comparisons showed that Sencogi-STSM has significantly better prediction scores than PSNR and SSIM.
-
(4)
Results on the Outlier Ratio analysis show that only 7.75% of the values predicted by both SSIM (OR = 0.8) and Sencogi-SMST (OR = 0.75) fall outside ±2 of the standard deviation (SD) of subjective DMOS, whereas all PSNR values (OR = 1) fall outside ±2 of the SD of subjective DMOS.


3.5 Discussion
The perception quality of videos compressed at two different constant rate factor values, and displayed on smartphone devices, has been calculated with three different objective measures: two traditional VQA measures called PSNR and SSIM, and one new VQA saliency based measure, called Sencogi-STSM. A previous study [27] proved the efficacy of the new Sencogi-STSM metric for predicting subjective quality scores of videos displayed on laptop computers, finding an overall better prediction performance by Sencogi-STSM than SSIM and PSNR metrics.
Results obtained in this study confirm the efficacy of Sencogi-STSM in predicting subjective scores for mobile phone screens. Globally, all the compared objective VQA metrics are able to significantly predict subjective scores of compressed videos displayed on smartphone devices, but only Sencogi-STSM and SSIM accurately predict subjective scores for highly compressed video (CRF 27), and only Sencogi-STSM is able to significantly predict subjective scores with low error. Moreover, Sencogi-STSM has lower RMSE values than PSNR and SSIM, especially for videos compressed at CRF 27. Sencogi-STSM obtained better prediction performance over the classic SSIM and PSNR metrics especially for highly distorted videos. For non-salience-compressed videos at CRF 27, STSM is 6.8% more accurate than SSIM. For salience compressed videos at CRF 27, STSM is 14.44% more accurate than SSIM. Results show that, at high compression levels, the logic behind Sencogi-STSM (which uses perceptual quality features) ensures that high saliency areas are given more significance than low saliency.
4 Conclusion
The performance of Sencogi Spatio-Temporal Saliency Metric (Sencogi-STSM) with mobile devices was compared to the most used objective Video Quality Assessment metrics, i.e. Peak Signal to Noise Ratio (PSNR) and Structural Similarity index (SSIM). Sencogi-STSM model uses spatio-temporal saliency to predict subjective perception of video quality. Sencogi-STSM uses four visual complexity algorithms, which calculate saliency within a video-frame, motion saliency between video-frames, delta-quality saliency showing where a quality change may be subjectively noticed, and noise detection. The performance evaluation with mobile devices showed that Sencogi-STSM is significantly more accurate in predicting subjective scores of videos compressed at high Constant Rate Factor (CRF) values than the other objective VQA metrics.
References
Chikkerur, S., Sundaram, V., Reisslein, M., Karam, L.J.: Objective video quality assessment methods: a classification, review, and performance comparison. IEEE Trans. Broadcast. 57, 165–182 (2011)
BT.500: Methodology for the subjective assessment of the quality of television pictures (n.d.). http://www.itu.int/rec/R-REC-BT.500-7-199510-S/en. Accessed 9 Oct 2017
Brunnstrom, K., Hands, D., Speranza, F., Webster, A.: VQEG validation and ITU standardization of objective perceptual video quality metrics [Standards in a Nutshell]. IEEE Sign. Process. Mag. 26, 96–101 (2009)
Staelens, N., Moens, S., Van den Broeck, W., Marien, I., Vermeulen, B., Lambert, P., Van de Walle, R., Demeester, P.: Assessing quality of experience of IPTV and video on demand services in real-life environments. IEEE Trans. Broadcast. 56(4), 458–466 (2010)
Seshadrinathan, K., Soundararajan, R., Bovik, A.C., Cormack, L.K.: A subjective study to evaluate video quality assessment algorithms. In: Human Vision and Electronic Imaging, vol. 7527, p. 75270 (2010)
Wang, Z., Bovik, A.C.: Modern image quality assessment. Synth. Lect. Image Video Multimedia Process. 2, 1–156 (2006)
Duchowski, A.: Eye Tracking Methodology, Theory and Practice, vol. 373. Springer Science & Business Media, New York (2007). https://doi.org/10.1007/978-1-4471-3750-4
Itti, L., Koch, C.: A saliency-based search mechanism for overt and covert shifts of visual attention. Vis. Res. 40, 1489–1506 (2000)
Wolfe, J.M.: Visual search in continuous, naturalistic stimuli. Vis. Res. 34, 1187–1195 (1994)
Mitchell, R.K., Agle, B.R., Wood, D.J.: Toward a theory of stakeholder identification and salience: defining the principle of who and what really counts. Acad. Manag. Rev. 22(4), 853–886 (1997)
Zhang, L., Shen, Y., Li, H.: VSI: a visual saliency-induced index for perceptual image quality assessment. IEEE Trans. Image Process. 23, 4270–4281 (2014)
Larson, E.C., Chandler, D.M.: Unveiling relationships between regions of interest and image fidelity metrics. In: Visual Communications and Image Processing 2008 (2008). https://doi.org/10.1117/12.769248
Zhang, W., Borji, A., Wang, Z., Le Callet, P., Liu, H.: The application of visual saliency models in objective image quality assessment: a statistical evaluation. IEEE Trans. Neural Netw. Learn. Syst. 27, 1266–1278 (2016)
Achanta, R., Estrada, F., Wils, P., Süsstrunk, S.: Salient region detection and segmentation. In: Gasteratos, A., Vincze, M., Tsotsos, John K. (eds.) ICVS 2008. LNCS, vol. 5008, pp. 66–75. Springer, Heidelberg (2008). https://doi.org/10.1007/978-3-540-79547-6_7
Hou, X., Zhang, L.: Saliency detection: a spectral residual approach. In: 2007 IEEE Conference on Computer Vision and Pattern Recognition (2007). https://doi.org/10.1109/cvpr.2007.383267
Harel, J., Koch, C., Perona, P.: Graph-based visual saliency. In: Advances in Neural Information Processing Systems, pp. 545–552 (2007)
Itti, L., Koch, C.: A saliency-based search mechanism for overt and covert shifts of visual attention. Vis. Res. 40, 1489–1506 (2000)
Itti, L., Koch, C., Niebur, E.: A model of saliency-based visual attention for rapid scene analysis. IEEE Trans. Pattern Anal. Mach. Intell. 20(11), 1254–1259 (1998)
Li, J., Levine, M., An, X., He, H.: Saliency detection based on frequency and spatial domain analyses. In: Proceedings of the British Machine Vision Conference 2011 (2011). https://doi.org/10.5244/c.25.86
Ma, Y.-F., Zhang, H.-J.: Contrast-based image attention analysis by using fuzzy growing. In: Proceedings of the Eleventh ACM International Conference on Multimedia, MULTIMEDIA 2003 (2003). https://doi.org/10.1145/957092.957094
Bian, P., Zhang, L.: Biological plausibility of spectral domain approach for spatiotemporal visual saliency. In: Köppen, M., Kasabov, N., Coghill, G. (eds.) ICONIP 2008. LNCS, vol. 5506, pp. 251–258. Springer, Heidelberg (2009). https://doi.org/10.1007/978-3-642-02490-0_31
Achanta, R., Hemami, S., Estrada, F., Susstrunk, S.: Frequency-tuned salient region detection. In: 2009 IEEE Conference on Computer Vision and Pattern Recognition (2009)
Yubing, T., Cheikh, F.A., Guraya, F.F.E., Konik, H., Trémeau, A.: A spatiotemporal saliency model for video surveillance. Cogn. Comput. 3, 241–263 (2011)
Arvanitidou, M.G., Sikora, T.: Motion saliency for spatial pooling of objective video quality metrics (2012)
Cogisen Homepage. http://www.cogisen.com. Accessed 22 Jan 2018
Mele, M.L., Millar, D., Rijnders, C.E.: The web-based subjective quality assessment of an adaptive image compression plug-in. In: 1st International Conference on Human Computer Interaction Theory and Applications, HUCAPP, Porto, Portugal (2017)
Mele, M.L., Millar, D., Rijnders, C.E.: Using spatio-temporal saliency to predict subjective video quality: a new high-speed objective assessment metric. In: Kurosu, M. (ed.) HCI 2017. LNCS, vol. 10271, pp. 353–368. Springer, Cham (2017). https://doi.org/10.1007/978-3-319-58071-5_27
Redi, J., Liu, H., Zunino, R., Heynderickx, I.: Interactions of visual attention and quality perception. In: Human Vision and Electronic Imaging XVI (2011). https://doi.org/10.1117/12.876712
SurveyGizmo Homepage. http://www.surveygizmo.com. Accessed 22 Jan 2018
Author information
Authors and Affiliations
Corresponding author
Editor information
Editors and Affiliations
Rights and permissions
Copyright information
© 2018 Springer International Publishing AG, part of Springer Nature
About this paper

Cite this paper
Mele, M.L., Millar, D., Rijnders, C.E. (2018). Sencogi Spatio-Temporal Saliency: A New Metric for Predicting Subjective Video Quality on Mobile Devices. In: Kurosu, M. (eds) Human-Computer Interaction. Interaction in Context. HCI 2018. Lecture Notes in Computer Science(), vol 10902. Springer, Cham. https://doi.org/10.1007/978-3-319-91244-8_43
Download citation
DOI: https://doi.org/10.1007/978-3-319-91244-8_43
Published:
Publisher Name: Springer, Cham
Print ISBN: 978-3-319-91243-1
Online ISBN: 978-3-319-91244-8
eBook Packages: Computer ScienceComputer Science (R0)